Full Length Research Article - (2022) Volume 17, Issue 5
Comparison Of Some Kinematic Variables Of The Triple Jump Between The Two World Championships Iaaf 2017 And 2018
Mustafa Abdulamir Hussain1*, Ahmed Sabea Atea Almujamay2 and Riyadh khaleel khammas3*Correspondence: Mustafa Abdulamir Hussain, College of Physical Education and Sports Sciences, University of Baghdad, Iraq, Email:
Abstract
The purpose of this paper is to comparing some kinematic variables and achievement between the (2017) and (2018) competitions in the triple jump to find the percentages of the teams, which may indicate the reasons for the difference in the level of the two championships. The differences may not be found in all variables, especially achievement, but at such global levels, the differences of the few numerical parts make a difference in international achievements, numbers and medals. The researchers adopted the descriptive approach using the method of comparisons to extract the results of the study, and the research community consisted of (27) jumpers, (12) competitors in the (2017) championship and (15) competitors in the (2018) championship, and the statistical bag (SPSS) was used to extract: (Mean), (Std.Divition), (Independent-Sample.T.Test). This study found that the starting angle of the hopscotch, the speed and distance of the jump is the most influential interval in the best achievement. The researchers recommend following up on such international reports and comparisons because they may give solutions and orientation in training for the most influential factors at different levels of achievement.
Keywords
Sport psychology. Sports exercise. Hop. Step. Approach speed
Introduction
The triple jump is a field and field game that requires the jumper to repeatedly generate maximum force to maintain horizontal speed during all stages of the jump. The jump consists of three stages where the athlete jumps on one foot, lands on the same foot, steps on the opposite foot, and finally jumps and lands in the sandpit (Miladinov , 2004). The distance of the triple jump depends on the ability of the jumps to apply the basic paths during each of them, and in each stage of the jump, a change in the movement structure occurs and a rhythm occurs that affects the timing of each central contraction. The jumper is in the correct position when jumping so that their feet are flat on the ground because the jump will affect the heel or toe negatively. The triple jump combines speed, strength and agility to jump as far as possible (Liu, 2012).
In such a situation of performance, many factors can contribute to the potential distance to jump. Each athlete has his own composition with a few different strengths and weaknesses. There are individual technical adaptations of the players to reduce energy loss in all parts of the skill. This means that there is no standard or variable only one is responsible for success. The men's triple jump finals (2017) were held and upon reaching the final, there was a strong competition between the Americans (Christian. Taylor) and (Will.Claye) due to the performance of their leading season and the final match was a battle between the two for gold, and (Taylor) jumped in The third round a distance of (17.68) meters after a jump (Claye) (17.63) meters.
That was enough to get him the gold medal, Clay's jump was enough to secure the silver medal and Portuguese (Nelson.Évora) took the bronze with his third round jump (17.19) meters (Catherine.et.al, 2018). The men's triple jump finals (2018) were held and it was a competition in which players competed for first place several times. After the first round, it was the Portuguese (Nelson.Évora) who advanced with a jump (17.14) meters, however, it was the Brazilian (Almir. Dos.Santos) who jumped to the lead with a distance of (17.22) meters, then regained (Évora) progress in the third round with a jump (17.40) meters.
After this jump, (Will.Clay) from the United States, a former winner in this event, began to exert his influence, and his jump in the fourth round (17.43) meters was in first place, and (Dos.Santos) won the silver medal with the best personal jump of ( 17.41 meters in the fifth round, and (Évora) and (Alexis.Copello) were unable to improve in the final rounds and therefore had to settle for third and fourth place, respectively (Catherine.et.al, 2018).
Through the information received, which was obtained after a long search in the websites of these tournaments, whose bulletins are issued in the form of a report for each competition and an individual analysis for each player through a scientific team for biomechanical analysis of these tournaments, the researchers noticed that there is a difference in the achievement values between the two tournaments and the best level was for the tournament Which was held in (2017) AD with a difference of (0.272) meters, and therefore he decided to put this digital data in a way of comparing the two tournaments in the kinematic variables of the players to find the percentages of the teams, which may indicate the reasons for the difference in the level of the two tournaments, and its usefulness is not limited to finding the differences of these values only, but it gives us an indication For the most important variables in which a statistical difference occurs, although these differences may not be found in all variables, especially achievement, but at such global levels the differences of the few numerical parts make a difference in international achievements, numbers and medals.
Research objective
• comparing some kinematic variables and achievement between the (2017) and (2018) competitions in the triple jump to find the percentages of the teams
Research Methodology and Field Procedures
Research methodology
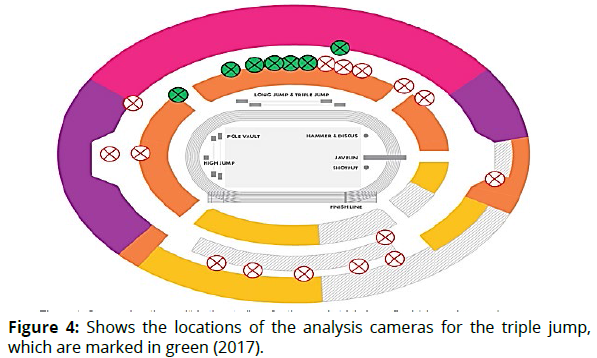
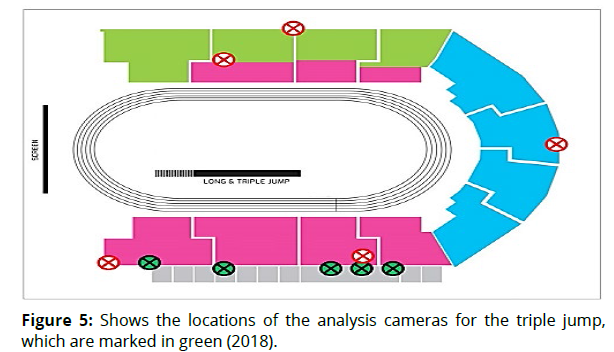
The researchers adopted the descriptive approach using the method of comparisons to extract the results of the study. The research community consisted of (27) jumpers, (12) competitors in the (2017) championship and (15) competitors in the (2018) championship. The locations of the cameras, their measurements and their type were determined as follows:
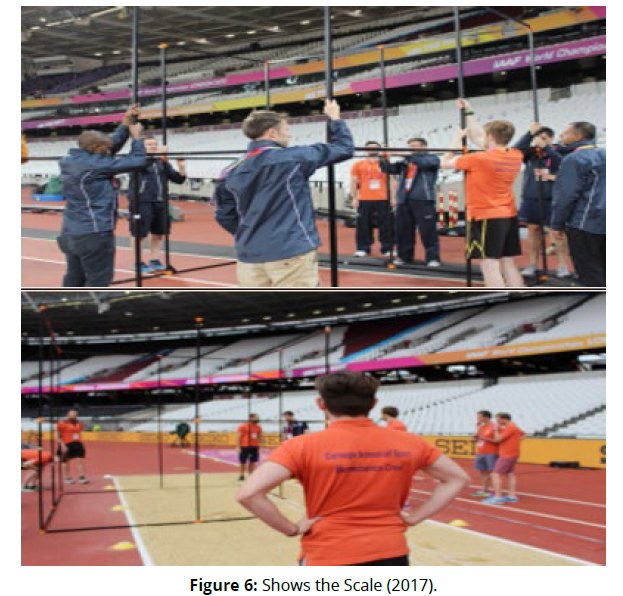
• Competitions (2017) AD: Seven excellent camera positions were identified and secured in the mount along the track straight with the running field. Calibration was carried out before and after each competition and a solid cubic calibration frame was placed in the running area several times over pre-selected areas on the Field length To ensure an accurate determination of the magnitude at which the athletes achieved their last step before the rise board for the hop, stride and jump, (9) cameras were used to record the movement as follows:
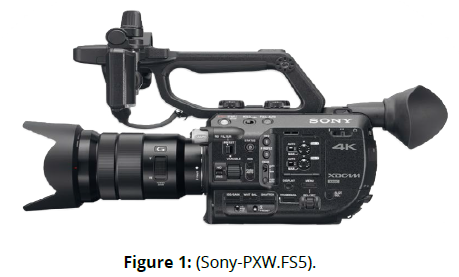
• (3) Cameras (Sony-PXW.FS5) operating at 200Hz (shutter-speed:1/1750; ISO:2500;FHD:1920x1080.px) captured players' movement through the calibration area to the advancement panel.
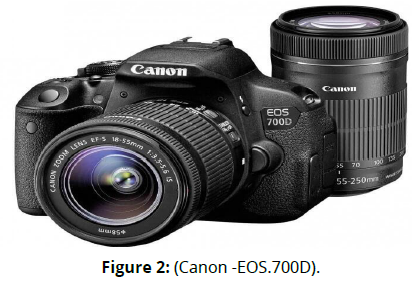
• (6) Cameras (EOS.700D-Canon) which operate at 60Hz (shutterspeed: 1/1000; ISO:1600; SHD:1280x720.px) to capture movement of hopscotch, step and jump sections including landing these cameras work in pairs to capture these areas of movement for the athletes.
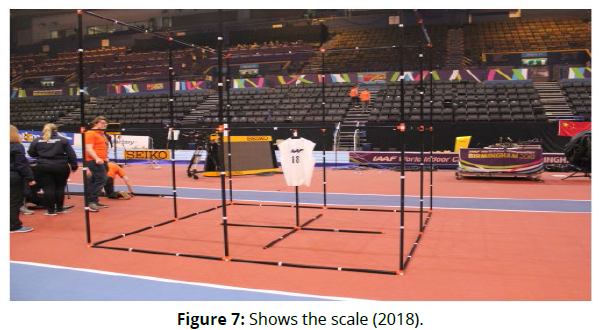
Competitions (2018) AD: Five distinct camera positions were identified and secured and were located in the field directly along it. Calibration was carried out before and after each competition, and a solid cubic calibration frame was placed on the running area several times over predetermined areas along the runway to ensure an accurate determination of the volume at which the athletes completed their last step before the rise board, hopscotch, stride and jump, (7) cameras were used to record the movement as follows:
• (3) Cameras (Sony-PXW.FS5) running at (200Hz.) (shutter-speed:1/1750; ISO:2000-4000;FHD:1920x1080.px) captured the movement of players across the calibration area to the advancement panel.
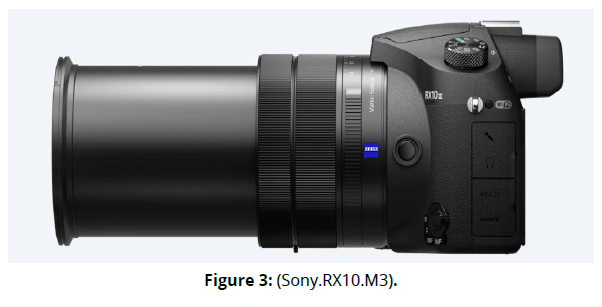
• (4) cameras (Sony.RX10.M3) running at (100Hz.) (shutter-speed:1/1000; ISO:2000-3600;SHD:1920x1080.px) were positioned on the field line to capture the hopscotch, step, and leap movements Including landings, these cameras work in pairs to capture these areas of movement for the athletes (Figures 1-7).
The (2017) finals were held on the night of August (10) in warm and calm weather, while the (2018) finals were held on the evening of Saturday (3) March.
Kinematic variables:
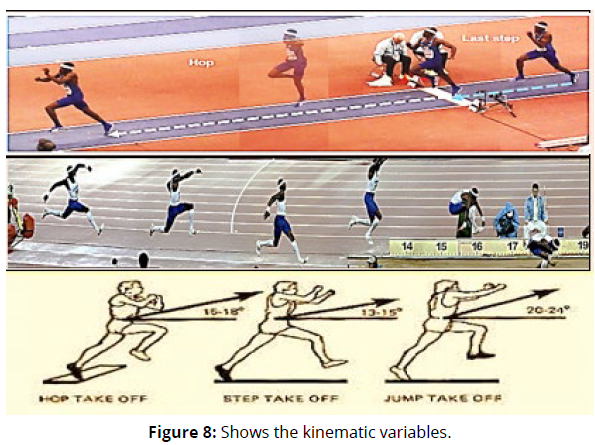
Statistical methods: The search data was processed through the Statistical Package for the Social Sciences (SPSS) used to extract: (Mean), (Std.Divition), (Independent-Sample.T.Test) (Table 1 and Figure 8).
| Variable |
|---|
| Official distance; The Official distance published in the results. |
| Effective distance; The distance measured from the tip of the foot at take-off to the take-off board plus the official distance. |
| Take-off loss; The distance from the foot tip (take-off foot) to the front edge of the take-off board. |
| Step length; last step before take-off board measured from the foot tip in each step to the next foot tip. |
| length (hop, step and jump); The length of the hop, step and jump as measured from the foot tip in each step to the next foot tip. |
| velocity (Last Step, hop, step and jump); |
| Take-off angle; The angle of the athlete’s (CM) at take-off relative to the horizontal of the hop, step and jump. |
| variables | Competition | Mean | Std.D ± | Mean. Diff |
Std.Err Diff | T | Sig |
|---|---|---|---|---|---|---|---|
1- Achievement |
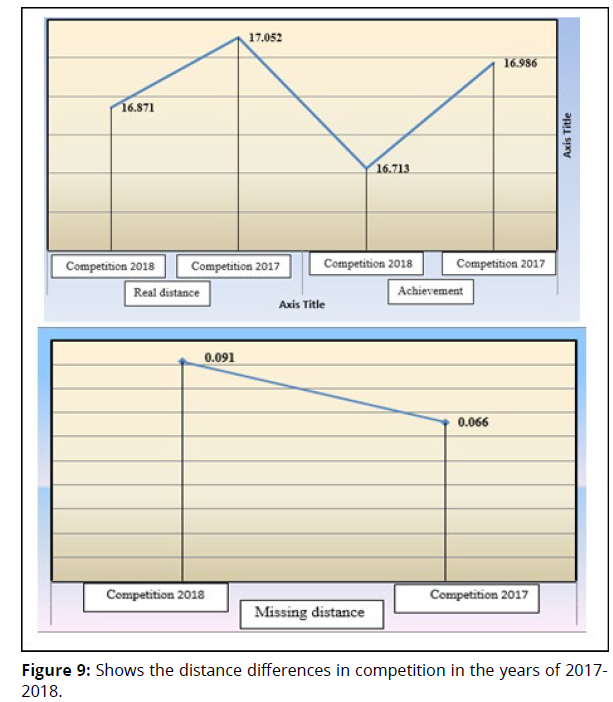
2017 | 16.986 | .448 | .272 | .211 | 1.293 | .208 |
| 2018 | 16.713 | .609 | |||||
2- real distance (Effective distance) |
2017 | 17.052 | .445 | .181 | .182 | .994 | .330 |
| 2018 | 16.871 | .487 | |||||
3- Missing distance (Take-off Loss) |
2017 | .066 | .057 | -.025 | .030 | .847 | .405 |
| 2018 | .091 | .089 | |||||
| 4- Step length before painting (Last.m) | 2017 | 2.267 | .142 | -.004 | .047 | .085 | .933 |
| 2018 | 2.271 | .104 | |||||
5- Hop length (Hop.m) |
2017 | 6.022 | .151 | -.084 | .083 | 1.017 | .319 |
| 2018 | 6.106 | .253 | |||||
6- Step length (Step.m) |
2017 | 4.986 | .393 | -.163 | .136 | 1.197 | .242 |
| 2018 | 5.149 | .316 | |||||
7- The length of the jump (Jump.m) |
2017 | 6.044 | .308 | .440 | .139 | 3.177 | .004 |
| 2018 | 5.604 | .393 | |||||
8- Step speed before painting (Last.m/s) |
2017 | 11.322 | .417 | .132 | .198 | .665 | .512 |
| 2018 | 11.190 | .575 | |||||
| 9- Hop speed (Hop.m/s) | 2017 | 9.144 | .275 | -.383 | .189 | 2.024 | .054 |
| 2018 | 9.527 | .605 | |||||
10- Step speed (Step.m/s) |
2017 | 8.270 | .471 | -.132 | .266 | .498 | .623 |
| 2018 | 8.402 | .815 | |||||
11- Jump speed (Jump.m/s) |
2017 | 6.944 | .474 | .391 | .162 | 2.412 | .024 |
| 2018 | 6.553 | .369 | |||||
12- (take-off angle for the hop) |
2017 | 17.433 | 1.728 | 1.613 | .645 | 2.502 | .019 |
| 2018 | 15.820 | 1.613 | |||||
13- (take-off angle for the step) |
2017 | 15.425 | 3.066 | -1.468 | 1.074 | 1.368 | .184 |
| 2018 | 16.893 | 2.518 | |||||
14- (take-off angle for the jump) |
2017 | 22.292 | 3.332 | -1.242 | 1.644 | .755 | .457 |
| 2018 | 23.533 | 4.842 | |||||
| • Degree of freedom = 25...significant at (Sig) ≤ (0.05). | |||||||
Results and Discussion
Discussion
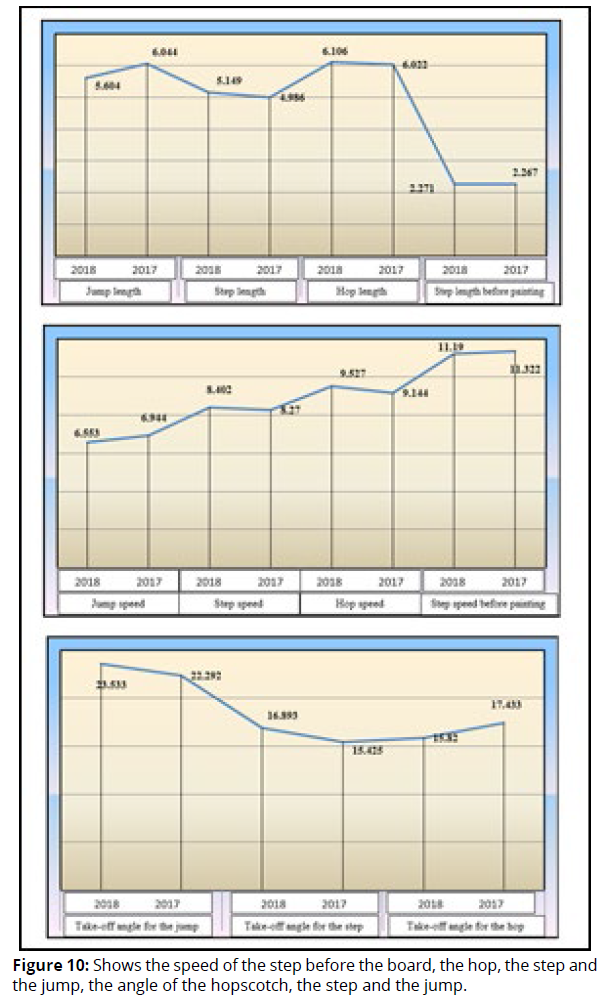
Through the results table, there were differences in the values of the kinematic variables and achievement between the two competitions for the competitors, some of which decreased and others increased, although they did not reach the level of the moral difference, but as we mentioned earlier that the differences at such levels are very small and may not give a statistical difference, but it certainly affects one way or another (Figures 9 and 10). The last in the achievement values, which decreased in the competitions (2018) by (1.63%), and in the real distance it was the largest in the competitions (2017) by (1.07%), and in the missing distance it was the largest in the competitions (2018) by (37.87%), and in The length of the step before the board was the largest for (2018) by (0.17%), the length of the hopscotch by (1.39%) and also in the length of the step before the jump by (3.26%), except for the length of the jump, which was the longest for the competitors in (2017) by (7.85%) As for the step speed before the board, it was the fastest for the competitors (2017) by (1.17%), and in the hopscotch speed the fastest competitor (2018) was by (4.18%), and in the step speed also by (1.56%), while in the jump speed it was The fastest competitor (2017) increased by (5.96%), while the angle of the hopscotch was the largest in (2017) with (10.19%), and In the starting angle of the step and jump, it was the largest for the competitors (2018) with a rate of (9.51%) and (5.56%), respectively.
It is noted that the nature of the trajectory of the angles according to the stages indicates a decrease in the step stage after the hopscotch, and it increases in the stage of jumping, because in the event of an increase in the angle of the step, this will lead to a loss of force that is exerted in the stage of the jump because the contact time for the stage of the jump will increase when descending from the stage of the step and this we observed in the difference between The two competitions in the rates of these angles.
It is reported that the flight angle in the step stage is less than the other flight stages (Čoh.M, 2011). Because if the flight height of the step stage is much higher, the negative vertical velocity when touching the jump will cause an excessive loss in horizontal velocity (Mohammed.Z, 2015). One of the studies proves that a strong correlation was found between the jump distance and the launch angle (Pavlović.R, 2018) and (Shabu.S.R, 2019).
Unlike other field games that require one max effort during the final performance, the triple jump requires a series of two submaximal efforts and one max effort and the jumper must meanwhile maintain horizontal speed while generating vertical velocity in the hopscotch, step, and jump. Athletes have different methods in terms of distributing effort over the three phases.
The results of the moral differences that appeared in the requirements of the jump in terms of its length and speed show the importance of this stage and its impact on the final achievement between the two competitions, but there are certainly other factors that contributed to this type of performance.
The distance of the jump is crucial, and the jumper must know how to increase its distance, as it is an important way to improve the overall performance. In addition, the angle of its launch is one of the factors affecting its increase or decrease (Jin.S,and,Liu.F,2014).
There are many variables that affect the performance of the triple jump, the length of the last two steps before getting up, the flight distances, the height of the center of gravity (CG), the flight angles in the distance (hop, step, jump), the missing distance, so each stage has an important role in determining the performance , where the first stage of the hopscotch is considered a critical stage for better performance in the next steps and the stages are implemented differently, but it must be in a way that prevents loss of horizontal speed during it (V.Jasminan,and,A.W.S.Chandana,2021).
The athletes focus mainly on generating the maximum controllable velocity during the approach in order to produce vertical velocity in the athletes in the flight phase and make some adjustment in body position and focus on converting the horizontal velocity to the vertical velocity, and once the approach phase is implemented the phases of flight will determine the distance of the jump. The kinematic variables that affect the performance of the flight stage here depend on the speed and angle (CG) when flying and the interaction of horizontal and vertical speeds when touching and their changes during flight.
Unnecessary decrease in horizontal velocity due to excessive vertical velocity which leads the athlete with more ground contact time during the three flight phases is the critical factor limiting the athletes performance (Eissa.A, 2014). Therefore, the researcher sees through the results that the rates of the starting angles of the step and the jump in the competitions (2017) were smaller than their rates in (2018), except for the angle of launching the hopscotch, which was in (2017) greater than the competitions (2018) and this may be one of the reasons for the increase in the achievement distance in ( 2017).
Conclusions and Recommendations
Conclusions
This study found that the starting angle of the hopscotch, the length of the jump and its speed are among the most influential factors and the differences in achievement between the two competitions. Also, the level of control of the jump-off (2017) was the fastest of the jumpers (2018) and also the best in the level of the missing distance, as its percentage at the level of achievement difference was (9%), Also, the smaller starting angles in the step stage give a great advantage in kinetic coordination in terms of the force that the jumper invests in the horizontal and vertical direction in the jump cauldron. The researcher recommends following up on such international reports and comparisons, because they may give solutions and orientation in training for the most influential factors at different levels of achievement.
References
1. Catherine, B, Tucker. Mark Cooke, Gareth Nicholson, Athanassios. Bissas, Stéphane Merlino. (2018). Biomechanical Report for the IAAF World Championships 2017: Triple Jump Men's. (Project: 2017 IAAF World Championships Biomechanics Research Project). P.1.
2. Catherine. B. Tucker, Athanassios. Bissas, and Stéphane. Merlino. (2019). Biomechanical Report for the IAAF World Indoor Championships 2018: Triple Jump Men. (Project: 2018 IAAF World Indoor Championships Biomechanics Study). P.5.
3. Čoh, M. a. (2011). Variability of Biomechanical Parameters in the Triple Jump Technique--A Case Study. (Sport Logia, 7), p.114.
4. Eissa, A. (2014). Biomechanical Evaluation of the Phases of the Triple Jump Take-Off in a Top Female Athlete. (Journal of Human Kinetics), p.31.
5. Jin S, Liu F. (2014). Kinetics Model Analysis and Technical Optimization Study on the Elite Men’s Triple Jump. (An Indian Journal of Bio Technology, 10, 2), p.69.
6. Liu H., Yu B (2012). Effects of phase ratio and velocity conversion coefficient on the performance of the triple jump. (J Sports Sci, 30), p.1531.
7. Miladinov O, B. P. (2004). Individual approach in improving the technique of triple jump for women. (New Studies in Athletics), p.29.
8. Mohammed, Z. (2015). The impact of the Three Pushes Take-offs Angle's Phases and Their Distributions Strides Lengths on the Performance in Triple Jump. (International Journal of Modern Trends in Engineering and Research, 2), p.319.
9. Pavlović, R. (2018). The differences of kinematic parameters Triple jump between finalists WCh Berlin, 2009-WCh Daegu, 2011. (European Journal of Physical Education and Sport), p.22.
10. Shabu, S. R. (2019). Kinematic Analysis on Selected Biomechanical Parameters of Hop Phase in Triple Jump. (International Journal of Physiology, Nutrition and Physical Education), p.150.
11. V. Jasminan1 , A. W. S. Chandana. (2021). Sagittal plane kinematics of triple jump: A review. (Journal of Sports and Physical Education, 8, 4), P.55.
