Full Length Research Article - (2022) Volume 17, Issue 6
Proprioception And Its Relationship To The Peripheral Perception Among Some Volleyball Players
Muntadhar Saheb Mahdi1*, Ebrahim Alidoust Ghahfarokhi2 and Adil AS Al-Salihy3*Correspondence: Muntadhar Saheb Mahdi, College of Physical Education and Sport Sciences, University of Kerbala, Iraq, Email:
2College of Physical Education and Sport Sciences, University of Tehran, Iran
3Head of the Mental Health Department, Psychological Research Centre, Iraqi Ministry of Higher Education and Scientific Research, Iraq
Received: 25-Nov-2022 Accepted: 21-Dec-2022 Published: 21-Dec-2022
Abstract
This paper aims to identify the level of peripheral perception of volleyball players, the level of proprioception among the research sample, and the level of the relationship between perception of the peripherals and proprioception among the research sample. The researchers used the descriptive approach in correlational relations due to its suitability to the research problem. The research community included a group of volleyball players in Iraq, where the sample included 28 players, eight of whom were excluded for conducting exploratory experiments, as the sample included Al-Shorta, Army, and Industry clubs. One of the essential results reached by the researcher is that: Advanced volleyball players have high abilities in perceiving the peripheral and receiving proprioception. The tests used have proven their efficiency and accuracy in measuring the research variables; there is a direct correlation between the ability to receive deep sense and the ability to perceive the peripherals., and there is a correlation between the internal and external senses and cognitive ability. One of the essential recommendations recommended by the researchers is that: carrying out similar studies on different samples in terms of the type of game or age group, adopting the Vienna Test System for Psychological Measurement and Evaluation in measuring psychological abilities due to its accuracy and credibility, and adopting the Al-Nuwaini test in measuring proprioception due to its accuracy and reliability
Keywords
Perception. Peripheral perception. Sensory perception. Extrasensory Perception. Proprioception. Vienna Test System.
Introduction
Perception is considered the axis of mental and psychological processes; instead, it is the main and fundamental axis of human mental processes. It reflects the extent of the individual’s ability to distinguish things, find a definition of things and events, and find the best way to deal with them according to experience or learning. The quality of the external and internal senses, considered input tools in the computer, through which data and information are entered into the computer, as well as the central processing unit, which depends on comparison with the stock of information about that information entered. He needs speed in performance, reaction, and decision-making, and all of this happens in parts of a second. The achievement ability of athletes depends on a group of factors, including physical fitness, which reaches certain limits for athletes with higher levels,as it cannot be skipped, but instead, maintaining them becomes the goal. Therefore, the difference between athletes remains in the psychological capabilities and the quality of mental processes, which will draw the real difference between athletes' results. The interest in perception without accurate measurement methods cannot be achieved, so the researchers relied on the latest internationally approved measurement methods to measure perception. The relationship between deep sensory perception and perception of the peripherals, according to the researchers, so this study will be the most important source that sheds light on these subtle variables according to the approved standards, which are considered highly reliable and credible.
Research Problem
The development of continuous training methods had a clear impact on the development of the level of performance of international teams. This development results from relying on advanced training methods that depend on scientific research in various aspects. Clear psychological abilities led international teams to pay attention to these variables that make the difference and be the decisive factor in many international and local championships. This interest was not in psychological abilities in all countries; instead, there was a disparity that led to this difference between those countries in sporting achievement. Despite this interest from some international teams in the psychological and mental aspects, there is a difference in determining the levels of those psychological and mental variables in sports teams. This difference is determined by the method of measuring those variables, so it is said that the diagnosis is half of the treatment or more, that the accurate diagnosis leads to the correct treatment, and this is what the researchers adopted in using the latest high-accuracy laboratory tests and devices that are internationally approved. Therefore, the research problem lies in the lack of interest in the mental and psychological side. If this interest was found, then accurate and reliable measurement methods were not used to detect the level of these variables among them, but the most important of which is the internal and external awareness of what has the primary role in higher and simple mental processes and all the results that result from them and their reflection on the level of performance and achievement.
Research objective:
• Identifying the level of peripheral perception of volleyball players.
• Identifying the level of proprioception among the research sample.
• Identifying the level of the relationship between perception of the peripherals and proprioception among the research sample.
Research hypotheses:
• Volleyball players have a high level of proprioception and peripheral perception.
• There is a significant correlation between the variables of perception of the peripheral and proprioception among the research sample.
Research fields:
• Human field: Advanced volleyball players in Baghdad
• Time field: (10/7/2022) to (2/11/2022)
• Spatial field: Sports club halls in Baghdad
Research Methodology and Field Procedures
Research methodology:
The researchers used the descriptive approach in correlational relations due to its suitability to the research problem.
Community and sample research:
The research community included a group of volleyball players in Iraq, where the sample included 28 players, eight of whom were excluded for conducting exploratory experiments, as the sample included Al-Shorta, Army, And Industry clubs.
Field Research Procedures
Tests used:
1. Test (proprioception):
• Name of the test: (Al-Nuwaini test for proprioception) (Muntadhar, Ali, Adil . 2022):
• The aim of the test: is to measure the ability to receive proprioception and correct the body position of athletes.
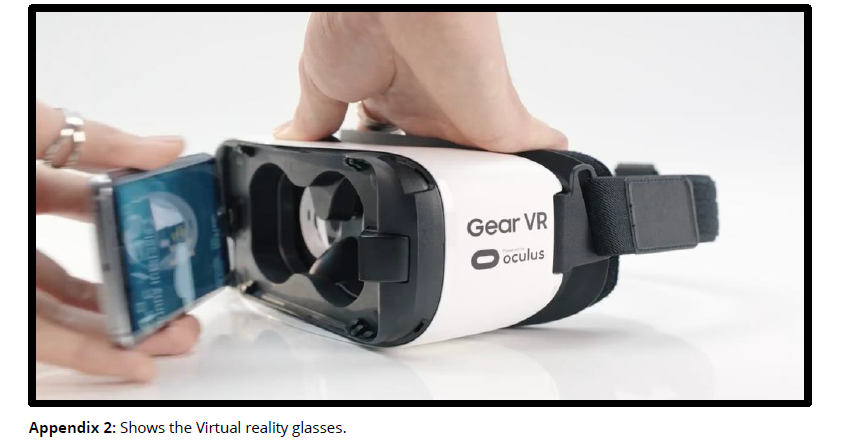
• Tools used: Samsung 3D glasses from Oculus clearly printed gradient angles with a height of 2 meters and a width of 1 meter, colored adhesive tape, a stopwatch, a whistle to set the time, some electronic equipment, and a camera.
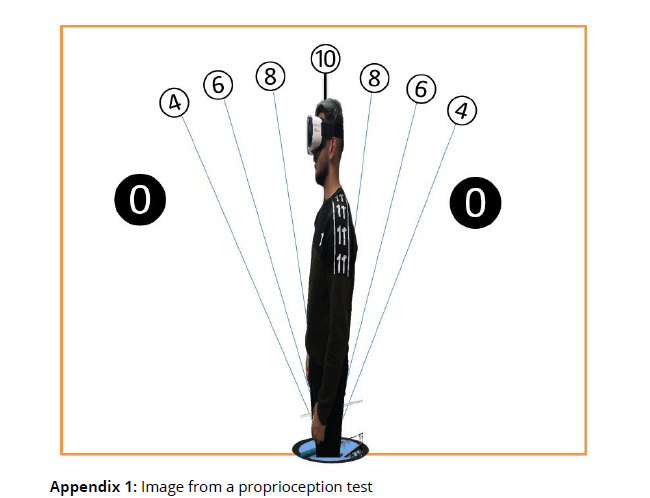
• Performance method: The player or the examinee stands in the corner of the room next to a straight wall on which a vertical line is drawn, where the examinee stands parallel to this line. The subject includes his feet inside a small circle side by side, stands erect, and the arbitrator stands next to him where he places the vertical line drawn in the straightness of the subject, and there are branches of side angles extending from the bottom of the wall on both sides of the straight line. These angles are sharp and gradual, as in the figure. The subject wears 3D virtual reality glasses A special video that affects balance is played for 30 seconds to identify the examinee's ability to correct his body position while watching the video, with another person standing in front of him to protect him from falling if that happens.
• Registration: The arbitrator holds a form in which he writes the numbers of the angles at which the examinee swayed within 30 seconds. The vertical line corresponds to 10 degrees; points are counted every 3 seconds. The first angle closest to him on both sides is 8 degrees, the third angle is 6 degrees, and the fourth is 4 degrees. In which the feet are lined up, it is given a zero. The points recorded during the specified period are collected, and the average for these points is extracted from 10 points, as in Appendix 1 (Table 1).
| Fields | Approval of experts and specialists | Chi-2 | Type sig | ||||
|---|---|---|---|---|---|---|---|
| Agree | % | Disagree | % | Calculated | Tabular | ||
| 1 | 11 | 84.615 | 2 | 15.385 | 6.231 | 3.84 | sig |
| 2 | 12 | 92.308 | 1 | 7.692 | 9.308 | sig | |
| 3 | 11 | 84.615 | 2 | 15.385 | 6.231 | sig | |
| 4 | 13 | 100 | 0 | 0 | 13 | sig | |
2. Peripheral Perception Test
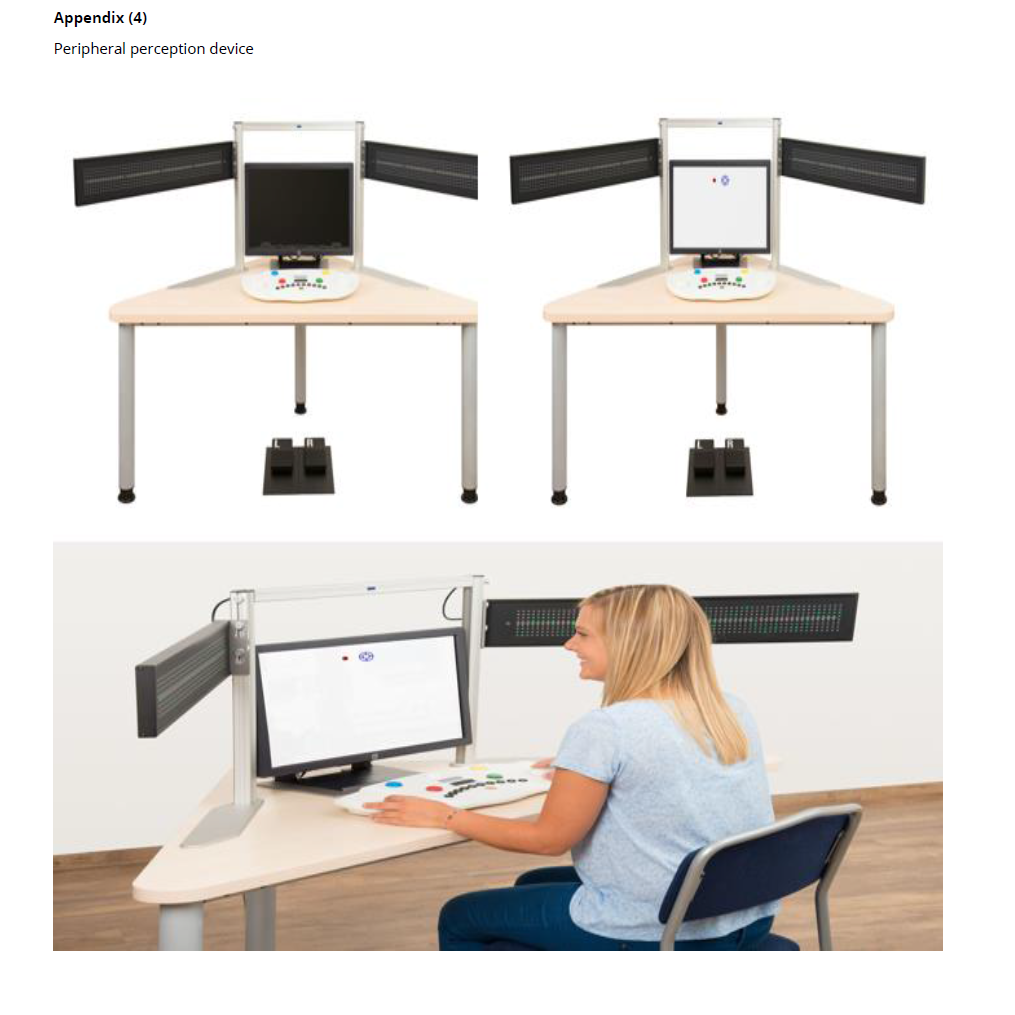
Peripheral perception hardware and testing device: Through this test (device) belonging to the Vienna test system of the Schofred company, the subject's capabilities to perceive and absorb stimuli emanating from the peripherals next to him are examined, and it is also considered an accurate, objective measurement of the field or field of visual perception. In the center of his field of vision, he should do a motion-following exercise. At the same time, peripheral light stimuli are sent to the subject, to which the subject must generate reactions. This unit requires an additional USP serial port on the computer to connect it.
This test assesses the perception and processing of external visual information. Good visual perception is necessary for many activities humans and machines engage in together.
The peripheral perception test (device) consists of the following three components:
A. The main device: which consists of the following parts and components:
A peripheral external screen (in the form of two wings), consisting of:
• A matrix of small LED Matrix lights, with eight rows and 64 columns on each side (from the right wing and the left wing).
• Light stimuli (stimuli) from the center to the periphery of the subject's field of vision.
• Ultrasound distance meter that records the location and distance of the subject's head in front of the computer screen, as the subject's head should not exceed the distance allocated for it, which ranges between (40-60 cm) as shown in the figure 1 (Figure 1).

Figure 1. An illustrative picture of the main device for the peripheral perception test.
B. Response Panel, Universal: It is a comprehensive keyboard (input panel) that the examinee uses to respond to the Vienna test system and all tests in that system, including the peripheral perception test. This panel consists of the following parts and components:
• Seven colored keys (red, blue, yellow, green, white, gray, black).
• Ten numbered keys (1, 2, 3, 4, 5, 6, 7, 8, 9, 0).
• One sensor switch (gold color).
• Two rotary calibration keys (white).
• Two standard joysticks.
• Possibility of connecting the board with foot pedals.
• This board is connected to the computer via a USP socket; for a detailed view of this painting, see figure 2 (Figure 2).

Figure 2. Response Panel, Universal.
C. Digital Foot Pedals:
In addition to the aforementioned comprehensive keyboard, digital pedals (for the right foot bearing the symbol R, and for the left foot bearing the symbol L) are required to be placed on the floor in front of the subject to record activities and apply the scale. These pedals are usually connected to a special socket on the back of the aforementioned universal keyboard; see figure 3 (Figure 3).

Figure 3. Digital Foot Pedals.
These pedals are used in tests that require pressure on two positions: On and off, in other words, tests that require two double-clicks, including the peripheral perception test, and many other tests that operate within the Vienna Test System that require this type of pedal.
Test Application
When preparing the subject for the test, he should be seated so that his eyes are level with the green markings to the right and left of the frame of the Peripheral Perception Unit. A height-adjustable table and/or chair is a necessity in this case. In the same way, the subject should sit so that his head (the horizontal location of the middle of the eyes) is facing the middle of the frame (the blue indicator on the frame), meaning that his head is exactly in the middle of the device. In addition, when installing and configuring the perimeter perception device, it should be ensured that the metal plate (the square base that holds the perimeter perception device placed on the table) is within the level of the edge of the table and that the computer screen is medium and centered within the square metal frame of the device. As shown in the figure 4 (Figure 4).

Figure 4. Correct setup and placement of the peripheral perception device.
As for the fattest subjects, it is not usually possible to measure the field of vision to 180 degrees because they will be sitting farther from the computer screen; therefore, their eyes will be placed beyond the ends of the wings. In such cases, the maximum visual field cannot be measured (this applies to all individuals who sit far from the computer screen).
When the examination is started and the subject is seated appropriately, a light stimulus - which occurs by emitting signals that emerge in the device - will move at a predetermined speed (when changes occur) on the foot pedal placed under his foot on the ground.
As the subject sits and looks at the computer screen and focuses his attention on the center of the screen from which he should move a distance between (40-60 cm), and when the subject moves less or more than the permissible distance, an alert will appear on the computer screen to alert the subject to return within the standard range For the examination. Then the device measures the angle of the total field of vision of the examined person. See the following figure 5 (Figure 5).

Figure 5. One of the respondents within the research sample applying the Perception Test.
Test stages:
Each test that is applied within the Vienna Test System (VTS), including the two research tools (peripheral perception) and (mental stress), goes through three main stages that can be summarized as follows:
1. Instructions Phase: Here, the examinee is given instructions and necessary information, step by step, about the test and the stimuli, questions, etc., that the examinee will face. In addition, how to use the universal keyboard, how to use the foot pedals, etc. It is also possible to use the keyboard or foot pedals with the right hand and foot, or the left hand and foot, according to the subject's desire.
2. Practice Phase: It is the phase that follows the instruction phase, in which the examinee is trained on how to respond to the test through some actual illustrative examples. If the examinee makes three mistakes or does not respond within (5) minutes, then The exercise phase will stop, and the program will ask the subject to refer back to the examiner for further instructions. Then the test taker (the examiner) can take the appropriate measures, that is, either by repeating the entire stage, or returning to the instructions stage, and so on, and thus making sure that the actual test is not done until after it becomes clear that the subject has understood and comprehended the instructions accurately.
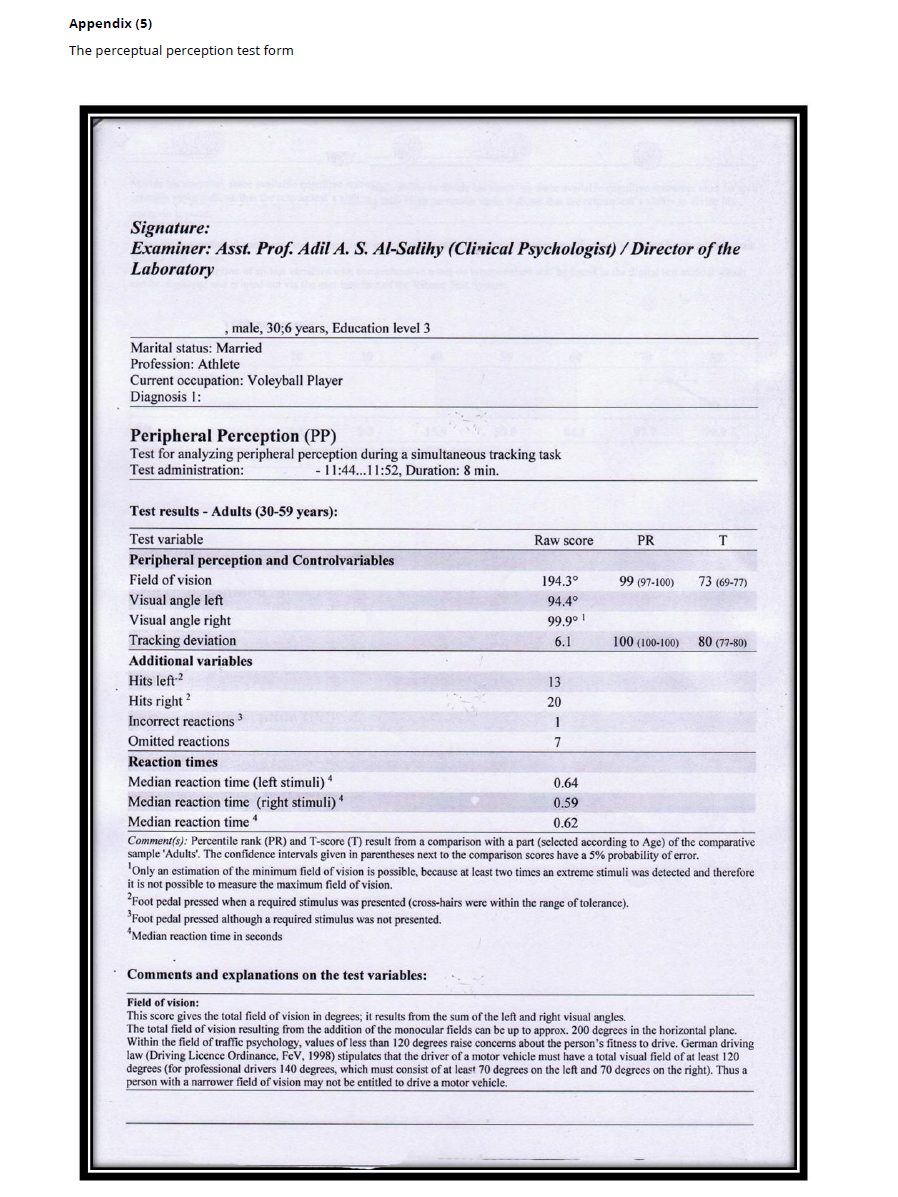
3. Test Phase: This is the phase that directly follows the exercise phase, in which the rotary knob on the comprehensive response panel (aforementioned) should be used with the right or left foot pedal as desired, provided that the examinee is warned not to use both pedals at the same time after completing the test, a help screen will appear asking us to either show the test results directly on the computer screen or print them on the printer. A paragraph with the time it takes to answer the test, showing the profile of the detailed test based on the standard scores as shown in figure 6 (Figure 6).

Figure 6. A clip from one of the illustrative forms of the profile of the results of the Peripheral Perception test.
Note that the profile (profile of life) is a graphic representation of the standard scores of the test; Through it, the subject's performance can be easily balanced against selected standard samples. The gray area indicates the midrange; the mean covers one standard deviation. As for the scores in the white area on the left side, they are considered to be below average. As for those in the white area on the right side, they are considered to be within the above-average level. The grade of the examinee is also indicated by a point. The range indicated to the left and right of this point, it indicates the range within any subject's performance, taking into account the issue of stability within a confidence level of 95%. As for the variables that can be measured within the Peripheral Perception test measured with a test device (Peripheral Perception) within the Vienna Test System, they can be explained as follows:
Variables used:
These variables were selected after reviewing specialists in the field of volleyball and those interested in the field of mental abilities in the sports field, as they fit the requirements of the mental volleyball game, and their results are reflected in the performance of players in this game, which are as follows:
A. Main variables:
• Field of vision: The result within this variable gives us the subject's full field of view calculated in degrees; it is the sum of the viewing angles of both the right and left eye. Viewing angles are calculated based on the network location within the perimeter perception device, the location of the two intersection lines, and the distance of the head from the measurement unit.
• Visual angles (right/left): The result within this variable gives us degrees of viewing angles (for both the right eye and the left eye) based on each of the network locations within the perimeter perception device, the location of the two intersection lines, and the distance of the head from the measurement unit as shown in the figure 7 (Figure 7).

Figure 7. Shows the ideal field and angles of vision for the left and right eyes.
B. Control variable:
• Deviation from tracking deviation (an indicator of concentration strength): The result within this variable gives us the degree of deviation of the two intersection lines (controlled by the subject using a rotating disk on the universal keyboard of the Vienna test system) from a moving target (at a constant speed but variable in the direction from right to left and vice versa) on the computer screen, and thus it is an indicator of the strength of concentration.
C. Subsidiary variables:
• The number of hits (right/left) (an indicator of the strength of attention): The score within this variable gives us the number of times the foot-pedal was pressed in response to the sudden appearance of a critical stimulus (a vertical line of light) on the right wing or left wing on the peripheral perception unit (provided that the two intersecting lines are on the computer screen within the permissible Tolerance Range). The more correct times the foot pedal is pressed, this is evidence of the strength of attention (mainly divided attention, i.e., the ability of the subject to pay attention to two things simultaneously). Note that the standard number that appears to the subject is 40 errors (20 lines appear on the right wing, and 20 lines appear on the left wing), and thus divided attention is calculated according to the following equation: (number of correct injuries ÷ 40) x 100%. (p. 353)
• The number of omitted reactions: It measures the number of times there is no reaction in response to the critical stimuli, i.e., the number of times the foot pedal is not pressed despite the presence of a critical stimulus (the appearance of a vertical line of light) note that this variable is complementary to the variable of the number of correct hits (an indicator of the strength of attention), so the greater the number of neglected reactions, the more it is an indicator of weakness (divided attention).
• Median reaction time to stimuli (right/left): Only correct reactions are used here to calculate the average reaction time in response to the stimuli that appear on the right wing and on the left wing (each separately) of the measurement unit of the peripheral perception system. That is, calculating the average time (in hundredths of a second) from the moment the stimulus (the critical stimulus) appears on one of the wings of the measuring unit of the peripheral perception device up to the moment the subject presses the foot pedal on the ground.
• The average total reaction time to the stimulus: Only correct reactions are used here in order to calculate the average total reaction time by extracting the arithmetic mean for each of the average reaction times for the stimulus (calculated in hundredths of a second) from the right side and the left side.
Test Forms:
There is only one standard format for the test with 40 stimuli (20 stimuli left/20 stimuli right).
Indicators of the validity and reliability of the peripheral perception test:
The peripheral perception test has several types of validity, which can be classified as follows:
Validity: A valid test is a test that achieves the function for which the test was designed well and the degree to which it can achieve specific goals, and the validity reflects the ability of the test to measure what it was designed to measure, knowing that the Perception of the Peripheral test has a number of the following types of validity:
First: Empirical Validity: This type of validity was achieved through the empirical field method in analyzing and preparing the test from the manufacturer.
Secondly: Content Validity: This type is achieved through rational analysis of the content of the test and defining it to subjective judgments.
1. Logical Validity: (Allen and Yen) indicate that this type of content validity is achieved by accurately defining the domain that the test measures, as well as through the logical design of the paragraphs to cover the essential areas for this domain. This type of validity is available in the current research tools because it adopted a precise definition, as indicated above.
2. Face Validity: The best way to extract virtual validity is to present the test items to a group of arbitrators to judge their validity in measuring the property to be measured. And set up two search tools from the manufacturer.
Third: Construct Validity: It means analyzing test scores based on the psychological structure of the phenomenon to be measured or in light of a specific psychological concept, which is the extent to which we can decide that the test measures a specific characteristic. This has been achieved through the following indicator: The construction of (Peripheral Perception) was done unambiguously and with a high level of accuracy to extract the raw and standard total scores for the test, which are considered as immediate measured measures by their association with the scores of individuals on the responses. The measure or test whose paragraphs are elected according to this indicator has constructive validity, and the two research tools were constructively valid according to this indicator when the manufacturer designed the two tests in the first place.
Fourthly: Criterion validity: A multicenter study was conducted at the University of Mannheim and the INFAR traffic psychology assessment center in southern Austria to investigate the correlations between the field of vision, measured by the perimeter perception test, and actual driving performance. Performance. Driving performance was evaluated using Standardized Driving Test methods. Each subject was given a specific road to drive and then rated by a psychologist on a five-point scale (1 = very good to 5 = very bad).
Based on the results of the PP test, the subjects were divided into two groups, depending on whether their field of vision was less than 160 degrees or more. Bearing in mind, however, that the sample of individuals with a field of vision <= 160° is relatively small. The Mann-Whitney U test was used to investigate whether or not these two groups differed in their results on the driving test. Individuals with a field of view <= 160 degrees were found to have a low score and significant significance. The results showed significant differences between the field of vision less than or equal to 160 degrees and the field of vision greater than 160 degrees.
As for Burgard, she also found in her study that the test had sufficiently logical content truth. It found that each of the variables of the field of view and deviation from track tracks is associated with a significant correlation ranging between -0.39 and 0.628, respectively, with the global evaluation of performance in the Standardized Driving Test. A study on traffic safety and older drivers that is currently being conducted on an ongoing basis has found that performance in driving is related to two variables: field of vision and deviation from tracking at -0.375 and 0.420, respectively.
A. Reliability: It is the consistency in test results, and the fixed test is reliable. Reliability is achieved if the test items measure the same concept, and the fixed test is the one that gives the same results after applying it to the same individuals. The Perception of the Peripheral test has very high stability among all the available studies that have studied it since the preparation of this test until now, as this test has internal consistency between 0.96 - 0.98.
Test time: The time required for the test is about (15) minutes (including instructions and the practice phase) (Adel Abdul Rahman Siddiq Al-Salihi et al. 2012).
Research tools:
• Two stopwatches.
• Lenovo type calculator.
• Oculus 3D glasses.
• Samsung S6 mobile device.
• 2 Nikon cameras.
• Measuring tapes.
• Colored adhesive tapes.
• Wall print included.
• Papers, pens, etc.
Exploratory experience:
Two exploratory experiments were conducted; the first was conducted on four players on 20/7/2022, where a proprioception test was conducted, and a second exploratory experiment was conducted on 5/8/2022, in which four players were tested in the peripheral perception test in the psychological laboratory and after adjusting the variables And the objective conditions of the tests are ready for application in its final form.
Main experiment:
After adjusting the test procedures, after conducting the reconnaissance experiments, the main experiment was conducted on a group of 20 players,and the conduct of the tests was controlled, accompanied by the assistant work team and researchers, where the main experiment was conducted from the period dated 27/7/2022 to 18/8/2022 where the players were tested in the psychological laboratory sponsored by the Iraqi Association for Psychotherapy, as well as the proprioceptive test was conducted in the halls and stadiums of sports clubs.
Statistical methods: The search data was processed through the Statistical Package for the Social Sciences (SPSS).
Results and Discussion
Presenting the results of the arithmetic mean and standard deviation:
The arithmetic mean value of the deep sense reception variable was (7.6980) at a deviation of (2.50814), indicating that the players enjoy a relatively high degree of the proprioceptive variable. The arithmetic mean value of the peripheral perception variable was (71.8000) at a deviation of (1.05631), and this indicates that the players enjoy With a high ability in the variable of perceiving the peripherals, as is the case in the variable of proprioception, and this proves the hypothesis of the first research (Table 2).
Variables |
Arithmetic mean | Standard deviation | Error in standard deviation |
|---|---|---|---|
| Proprioception | 7.698 | 2.50814 | 0.56084 |
| Peripheral perception | 71.8 | 1.05631 | 0.2362 |
Presentation and discussion of the results and the significance of the correlation between the research variables:
According to the two tables above, the calculated value of the T-test was (2.22), while its tabular value was (2.10), and the significance was defective. The value of the correlation coefficient was (0.464) at a level of (0.39), indicating that the correlation is strong. The kinesthetic between the internal sensation and the external peripheral requires a consensual relationship between all sensory perceptions, as confirms that "muscular kinetic sensation is the cornerstone of the process of acquiring and developing kinetic habits in general, and sports skills in particular and the high accuracy of sensory and kinetic perceptions increases the ability of the individual athlete to control and consciously direct the movement of the body as a whole in space, in addition to that through muscular kinetic sensation, it can provide the individual with information about the characteristics of the required kinesthetic perception, which can correct performance (Craty B.I. 1978) (Tables 3 and 4).
Variable |
T value calculated | T value Tabular | Type sig |
|---|---|---|---|
| Proprioception- Peripheral perception | 2.222 | 2.101 | sig |
Variable |
Correlation coefficient value | Level sig | Type sig |
|---|---|---|---|
| Proprioception- Peripheral perception | 0.464 | 0.039 | strong |
Likewise, (Iman Hamad Shehab), quoting Simon, indicates, “The mechanics of kinetic control depends on sending specific orders to the muscles to perform kinetic work and achieve the goal in a good way. The central nervous system causes the body and head to return to a normal position, and in the same way, all other movements can be controlled (Shehab. 1998).
The researchers believe that there is a set of integrated elements that combine to form a correct or rapid movement or reaction, including the quality of mental training, training of the senses, the quality of neurotransmitters, and imagination, which together develop internal and external perception and produce an ideal performance that achieves the required achievement, as well as attention to visual vision, which is the main entrance to external information. In addition to the other senses, where the eyes play the role of the receiver for the visual sensation, which has a major role in the kinetic activity, as it participates in all kinds of other sensations in realizing and understanding the nature of kinetic performance, and matching it with the circumstances and conditions of the activity, and helps the player to understand all the skills that he performs (Mahjoub. 2002).
Conclusions and Recommendations
Conclusions
• Advanced volleyball players have high abilities in perceiving the peripheral and receiving proprioception.
• The tests have proven their efficiency and accuracy in measuring the research variables.
• There is a direct correlation between the ability to receive deep sense and the ability to perceive the peripherals.
• There is a correlation between the internal and external senses and cognitive ability.
Recommendations
• Carrying out similar studies on different samples regarding the type of game or age group.
• Adopting the Vienna Test System for Psychological Measurement and Evaluation in measuring psychological abilities due to its accuracy and credibility.
• Adopting the Al-Nuwaini test in measuring proprioception due to its accuracy and reliability.
• Adopting exercises that develop the senses within the training units of the sports teams.
• Conducting research and studies to determine the percentage of senses working in various sports.
• Conducting research and studies in the field of extrasensory abilities in the sports field.


References
Adil Abdul Rahman Siddiq Al-Salihy, et. al. 2012. Perception of the peripheral and its relationship to mental stress: Journal of Educational and Psychological Sciences, Iraqi Association for Educational and Psychological Sciences, No. 93, pp. 343-385.
Craty B.I. 1978. Psychology in Contemporary Sport M.F.I. G , p.26-28.
Iman Hamad Shehab. 1998. A proposed program in kinetic education to raise the level of mental ability and sensory perception in children aged 4-5 years, PhD thesis, University of Baghdad, College of Physical Education, p. 26.
Muntadhar,ali,adil . 2022 .Journal of Positive School Psychology; 2022, Vol. 6, No. 8, Comparison of the senses of balance and proprioception between some individual and team sports players (a comparative study),p5278.
Wajih Mahjoub. 2002. Learning Physiology, 1st edition, Amman, Dar Al-Fikr for printing, publishing, and distribution, p. 121.